11 The chapter nets at work
The entries are grouped by task domain, over three chapters. This one is recognition: the chapter nets on pictures, at real-world scale and then on real problems — classification backbones first, where every layer is one Part 1 proved, then detection, inspection, sign language, leaves and tumours, each with a dataset, the field’s own baseline to beat, and beside the demo the architectures that field uses. Chapter 12 leaves recognition behind, and Chapter 13 plays games against their exact solutions.
11.1 Vision classifiers
Image-classification backbones built out of conv / pool / batch-norm / residual / attention / patch-embed — the exact layer kit VJP’d in Part 1. If a chapter of Part 1 proved it, a bestiary entry below puts it to work.
LeNet (Bestiary/LeNet.lean)
Zero new primitives — just conv2d \(+\) maxPool \(+\) dense. The 1998 original (LeCun et al. 1998, IEEE 1998). Variants: LeNet-5 (61K params, the canonical CNN) and LeNet-300-100 (266K params, pure-MLP baseline). Historical importance; still the ground-truth pattern every later CNN riffs on.
def leNet5 : NetSpec where
  name   := "LeNet-5"
  imageH := 32
  imageW := 32
  layers := [
    .conv2d 1 6 5 .valid .relu,           -- 32×32 → 28×28
    .maxPool 2 2,                         -- 28×28 → 14×14
    .conv2d 6 16 5 .valid .relu,          -- 14×14 → 10×10
    .maxPool 2 2,                         -- 10×10 → 5×5
    .flatten,
    .dense (16 * 5 * 5) 120 .relu,        -- 400 → 120
    .dense 120 84 .relu,
    .dense 84 10 .identity                -- 10-class MNIST output
  ]
AlexNet (Bestiary/AlexNet.lean)
Zero new primitives — five convs, three FCs, pools. The 2012 ImageNet winner that restarted modern deep learning (Krizhevsky et al. 2012, NeurIPS 2012). Variants: AlexNet (62M, paper-exact at 60M; the first FC’s fan-in is pinned to the paper’s \(6 \cdot 6 \cdot 256\), while the spec’s own body ends at \(7 \times 7\)) + tiny CIFAR fixture. \(\sim \)58M of the 62M live in the three FC layers, which is precisely why every post-2015 CNN dropped FC stacks for globalAvgPool + one final dense. LRN is omitted (replaced in the field by BatchNorm in 2015); dropout is training-time only.
Krizhevsky trained on two GTX 580 cards (3 GB each) for \(\sim \)6 days, the two-tower model is a hardware constraint, not a design choice. The winning submission combines convnets with KNN sampling and 10-crop test-time averaging.
def alexNet : NetSpec where
  name   := "AlexNet (Krizhevsky 2012)"
  imageH := 227
  imageW := 227
  layers := [
    .convBn 3 96 11 4 .same,              -- 11×11 stride 4
    .maxPool 2 2,                         -- 3×3 stride 2 in paper
    .conv2d 96 256 5 .same .relu,
    .maxPool 2 2,
    .conv2d 256 384 3 .same .relu,
    .conv2d 384 384 3 .same .relu,
    .conv2d 384 256 3 .same .relu,
    .maxPool 2 2,
    .flatten,
    .dense (6 * 6 * 256) 4096 .relu,      -- ~95% of params live here
    .dense 4096 4096 .relu,
    .dense 4096 1000 .identity
  ]
VGG (Bestiary/VGG.lean)
Zero new primitives — pure stacks of \(3\times 3\) convs + max-pool + a heavy dense head. VGG (Simonyan & Zisserman 2014, arXiv:1409.1556) was the deep-CNN era’s reference architecture for two years between AlexNet and ResNet. Its design philosophy reduced to one rule: “always use \(3\times 3\) kernels and add depth.” Two stacked \(3\times 3\)s cover the receptive field of a \(5\times 5\) with \(\sim \)30% fewer params and an extra nonlinearity in the middle; three stacked \(3\times 3\)s match a \(7\times 7\). The whole architecture is just that trick repeated.
Table 11-1 is all four paper variants.
|
Name |
Per-stage convs |
Params |
|
VGG-11 |
(1, 1, 2, 2, 2) |
132.9M |
|
VGG-13 |
(2, 2, 2, 2, 2) |
133.0M |
|
VGG-16 |
(2, 2, 3, 3, 3) |
138.4M |
|
VGG-19 |
(2, 2, 4, 4, 4) |
143.7M |
All paper-exact. The big numbers come almost entirely from the FC head: the first dense layer alone (\(7\times 7\times 512 \to 4096\)) is \(\sim \)102M of the 138M for VGG-16.
def vgg16 : NetSpec where
  name   := "VGG-16"
  imageH := 224
  imageW := 224
  layers := [
    .conv2d 3 64 3 .same .relu, .conv2d 64 64 3 .same .relu,    .maxPool 2 2,
    .conv2d 64 128 3 .same .relu, .conv2d 128 128 3 .same .relu, .maxPool 2 2,
    .conv2d 128 256 3 .same .relu, .conv2d 256 256 3 .same .relu,
    .conv2d 256 256 3 .same .relu,                              .maxPool 2 2,
    .conv2d 256 512 3 .same .relu, .conv2d 512 512 3 .same .relu,
    .conv2d 512 512 3 .same .relu,                              .maxPool 2 2,
    .conv2d 512 512 3 .same .relu, .conv2d 512 512 3 .same .relu,
    .conv2d 512 512 3 .same .relu,                              .maxPool 2 2,
    .flatten,
    .dense (7 * 7 * 512) 4096 .relu,
    .dense 4096 4096 .relu,
    .dense 4096 1000 .identity
  ]
VGG-16 / VGG-19 still appear in production today as feature extractors (perceptual loss, style transfer) — those FC features turn out to encode useful image structure even after the classification head fell out of favor.
Highway Networks (Bestiary/Highway.lean)
Zero new math — the architecture is built entirely from the product rule and additive fan-in (Chapter 1’s toolkit) applied to two parallel dense / conv paths, and zero new primitives: the two paths are two NetSpecs below and the gate-blend is prose (Srivastava, Greff, Schmidhuber 2015, arXiv:1505.00387). Variants: one highway layer at the paper’s width of 50 units, the same layer at width 100, tiny.
A two-headed network: a main path \(H(x)\) (any transformation, typically dense \(+\) ReLU) and a transform gate \(T(x)\) (its own dense \(+\) sigmoid, output in \([0, 1]\)). The output blends the two:
\(T\) learned per element gives the network a continuous knob between “pass through” (\(T \to 0\)) and “transform fully” (\(T \to 1\)). The gradient through the blend is exactly product rule + additive fan-in (Theorems 13, 12), so no new derivation is needed.
def highway50Main : NetSpec where
  name   := "Highway-50 — main path H(x)"
  imageH := 1
  imageW := 1
  layers := [
    .dense 50 50 .relu                           -- H(x)
  ]

def highway50Gate : NetSpec where
  name   := "Highway-50 — transform gate T(x)"
  imageH := 1
  imageW := 1
  layers := [
    .dense 50 50 .identity                       -- T(x), sigmoid applied at blend
  ]
The pedagogical hook: ResNet (Chapter 5) drops the gate altogether and sums both paths, \(y = H(x) + x\). Highway showed in 2015 that some kind of bypass made very deep networks trainable; ResNet showed six months later that the gate could be a constant and you’d save the parameters. ResNet won by simplifying away \(T\), but the underlying calculus is identical — product + additive fan-in either way.
ResNet (Bestiary/ResNet.lean)
Zero new primitives: Chapter 5 proves and trains both block forms, the basic block as ResNet-34 and the bottleneck as ResNet-50, so .bottleneckBlock is a chapter net’s primitive rather than the bestiary’s. This entry catalogs the standard ResNet family (He et al. 2015, arXiv:1512.03385). The basic-block variants (R18, R34) stack two \(3\times 3\) convs per residual unit; the bottleneck variants (R50, R101, R152) use \(1\times 1\) reduce \(\to \) \(3\times 3\) work \(\to \) \(1\times 1\) expand around a residual skip — three convs per block instead of two, but the expensive \(3\times 3\) now runs at \(1/4\) the input channels, so per-block parameter count actually drops. Table 11-2 is the family.
|
Name |
Block |
Stage block counts |
Params |
|
ResNet-18 |
basic |
(2, 2, 2, 2) |
11.7M (paper 11.7M) |
|
ResNet-34 |
basic |
(3, 4, 6, 3) |
21.3M (paper 21.8M) |
|
ResNet-50 |
bottleneck |
(3, 4, 6, 3) |
25.6M (paper 25.6M) |
|
ResNet-101 |
bottleneck |
(3, 4, 23, 3) |
44.5M (paper 44.5M) |
|
ResNet-152 |
bottleneck |
(3, 8, 36, 3) |
60.2M (paper 60.2M) |
All five share the same stem (\(7\times 7\) stride-2 conv + \(3\times 3\) stride-2 max pool), the same 4-stage layout and the same GAP + single-FC head; the basic variants run the stages at \(64 \to 128 \to 256 \to 512\) channels, the bottleneck ones at \(256 \to 512 \to 1024 \to 2048\). They differ only in block type and stage block-counts.
def resnet50Imagenet : NetSpec where
  name := "ResNet-50 (ImageNet)"
  convPadStyle := .symmetric   -- torchvision's 7x7/s2 stem padding, not XLA SAME
  imageH := 224
  imageW := 224
  layers := [
    .convBn 3 64 7 2 .same,
    .maxPool 3 2,
    .bottleneckBlock  64  256 3 1,             -- stage 1: 3 blocks
    .bottleneckBlock 256  512 4 2,             -- stage 2: 4
    .bottleneckBlock 512 1024 6 2,             -- stage 3: 6
    .bottleneckBlock 1024 2048 3 2,            -- stage 4: 3
    .globalAvgPool,
    .dense 2048 1000 .identity
  ]
The residual chain rule (Theorem 60) applies to the bottleneck too — it composes three convolutions instead of two inside the branch — and Chapter 5 carries it to the full network: Theorem 62 is the backward of this exact ResNet-50, with its step tie, seal and data-parallel tie (Theorems 66, 69 and 71) beside ResNet-34’s.
WRN (Wide ResNet) (Bestiary/WRN.lean)
Zero new primitives — the residual block of Chapter 5, just widened. Zagoruyko & Komodakis 2016 (arXiv:1605.07146) take the ResNet block and turn the depth knob in (40 layers down from 1000+) and the width knob out (multiply every channel count by \(k\), typically 2–10). Result: WRN-40-4 matches the 1001-layer ResNet on CIFAR-10/100 with fewer parameters and several times faster training, and WRN-28-10 (36.5M in the paper) beats it. Width turned out to be a more efficient axis to scale than depth. Table 11-3 is the variants here.
|
Name |
Depth |
\(k\) |
Params |
|
WRN-28-10 |
28 |
10 |
36.5M |
|
WRN-40-2 |
40 |
2 |
2.2M |
|
WRN-22-8 |
22 |
8 |
17.2M |
All paper-exact. The N-k naming follows the paper: \(N\) is depth (must be \(6n+4\) for some \(n\) to balance the 3-stage design), \(k\) is the widening factor that multiplies the \(16 \to 32 \to 64\) channel sequence to \(16k \to 32k \to 64k\).
def wrn28_10 : NetSpec where
  name   := "WRN-28-10"
  imageH := 32
  imageW := 32
  layers := [
    .convBn 3 16 3 1 .same,                   -- stem
    .residualBlock 16 160 4 1,                -- stage 1: 4 blocks @ 32×32
    .residualBlock 160 320 4 2,               -- stage 2: 4 blocks @ 16×16
    .residualBlock 320 640 4 2,               -- stage 3: 4 blocks @ 8×8
    .globalAvgPool,
    .dense 640 10 .identity
  ]
The paper also adds dropout between the two convs inside each residual block, which we omit (static-graph scope — no per-step masks). The dropout-free WRN variant is also reported in the paper and lands within \(\sim \)0.3% of the dropout one on CIFAR-10.
SqueezeNet (Bestiary/SqueezeNet.lean)
One new primitive (.fireModule). AlexNet-level accuracy in 1.25M params via the fire module (Iandola et al. 2016, arXiv:1602.07360): squeeze 1\(\times \)1 conv followed by parallel expand 1\(\times \)1 + 3\(\times \)3 convs concatenated. The early efficiency-CNN family alongside MobileNet and ShuffleNet. Table 11-4 is the two versions.
|
Name |
Stem |
Params |
|
SqueezeNet 1.0 |
7\(\times \)7 stride 2 (96 ch) |
1.25M |
|
SqueezeNet 1.1 |
3\(\times \)3 stride 2 (64 ch), earlier downsample |
1.24M |
Both paper-exact, plus a tiny fixture. SqueezeNet 1.1 is the default for downstream use: same accuracy at \(\sim \)2\(\times \) fewer FLOPs.
def squeezeNet1_1 : NetSpec where
  name   := "SqueezeNet 1.1"
  imageH := 224
  imageW := 224
  layers := [
    .convBn 3 64 3 2 .same,                     -- 3×3 stride-2 stem (vs 1.0's 7×7)
    .maxPool 2 2,
    .fireModule 64  16 64  64,                  -- Fire2  → 128
    .fireModule 128 16 64  64,                  -- Fire3
    .maxPool 2 2,                               -- earlier downsample
    .fireModule 128 32 128 128,                 -- Fire4  → 256
    .fireModule 256 32 128 128,                 -- Fire5
    .maxPool 2 2,
    .fireModule 256 48 192 192,                 -- Fire6  → 384
    .fireModule 384 48 192 192,                 -- Fire7
    .fireModule 384 64 256 256,                 -- Fire8  → 512
    .fireModule 512 64 256 256,                 -- Fire9
    .conv2d 512 1000 1 .same .relu,             -- 1×1 to classes
    .globalAvgPool                              -- GAP emits 1000 logits
  ]
GoogLeNet / Inception v1 (Bestiary/Inception.lean)
One new primitive (§ 150). The parallel-branch architecture that won ImageNet 2014 (Szegedy et al. 2014, arXiv:1409.4842). Three durable contributions, each still standard kit:
1\(\times \)1 conv as dimension reducer — placed before the expensive 3\(\times \)3 / 5\(\times \)5 branches, it keeps parallel-branch FLOPs tractable. This is the move every later efficiency-CNN family (MobileNet, EfficientNet, ResNet bottleneck, ShuffleNet) builds on.
Global average pool replaces the FC head (idea cited from Network-in-Network 2013, popularized here). GoogLeNet’s classifier is one globalAvgPool \(\to \) dense, not VGG’s three-stack of 4096-wide FCs — the same head pattern Chapter 5 onward inherits.
Auxiliary classifiers branched off the middle of the network at training time, providing intermediate gradient signal. A precursor to deep supervision; the bestiary omits them for spec simplicity.
GoogLeNet ships at 7M parameters — \(\sim \)\(20\times \) smaller than VGG-16 at competitive accuracy on ImageNet 2014.
def googLeNet : NetSpec where
  name   := "GoogLeNet (Inception v1)"
  imageH := 224
  imageW := 224
  layers := [
    -- Stem
    .convBn 3 64 7 2 .same,
    .maxPool 2 2,                               -- 56×56
    .convBn 64 64 1 1 .same,
    .convBn 64 192 3 1 .same,
    .maxPool 2 2,                               -- 28×28
    -- Inception 3a, 3b
    .inceptionModule 192 64 96 128 16 32 32,    -- → 256
    .inceptionModule 256 128 128 192 32 96 64,  -- → 480
    .maxPool 2 2,                               -- 14×14
    -- Inception 4a..4e
    .inceptionModule 480 192 96  208 16 48  64,  -- 512
    .inceptionModule 512 160 112 224 24 64  64,  -- 512
    .inceptionModule 512 128 128 256 24 64  64,  -- 512
    .inceptionModule 512 112 144 288 32 64  64,  -- 528
    .inceptionModule 528 256 160 320 32 128 128, -- 832
    .maxPool 2 2,                                -- 7×7
    -- Inception 5a, 5b
    .inceptionModule 832 256 160 320 32 128 128, -- 832
    .inceptionModule 832 384 192 384 48 128 128, -- 1024
    .globalAvgPool,
    .dense 1024 1000 .identity
  ]
Inception v3 / v4 (Bestiary/Inception.lean)
Zero new primitives — reuses § 150. Inception v3 (Szegedy et al. 2015, arXiv:1512.00567) and v4 (2016, arXiv:1602.07261) are recipe-and-refinement papers more than architecture papers. Three contributions worth pulling out from v3:
Label smoothing: the cross-entropy target is \((1 - \varepsilon )\, \mathrm{onehot} + \varepsilon / K\), which puts \(1 - \varepsilon + \varepsilon /K\) on the true class (\(0.91\) at \(\varepsilon = 0.1\), \(K = 10\)) and \(\varepsilon / K\) elsewhere, instead of a hard one-hot. Prevents the softmax from collapsing all probability onto the argmax, which improves calibration and ImageNet accuracy. Now standard in every modern recipe (DeiT, ConvNeXt, our own TrainConfig.labelSmoothing).
Asymmetric factorizations: a 7\(\times \)1 followed by a 1\(\times \)7 conv replaces a single 7\(\times \)7 with the same receptive field at \(\sim \)\(1/3.5\) the FLOPs. Variant blocks include 1\(\times \)3 + 3\(\times \)1 pairs.
BN-Aux on the auxiliary classifier branch — the auxiliary classifier of v1 was rebranded as a regularizer rather than a gradient-injection mechanism.
Inception v4 layers more refinement on top: a wider initial stem (stem-A / stem-B / stem-C blocks), three Inception module variants specialized per spatial resolution, and a residual variant (Inception-ResNet) tested in the same paper. Variants here: Inception-v3 (23.8M, paper 23M), Inception-v4 (33M, paper 42M — a bit low because our unified .inceptionModule primitive approximates v3/v4’s richer module catalog).
Xception (Bestiary/Xception.lean)
One new primitive (.separableConv). “Extreme Inception” (Chollet 2017, arXiv:1610.02357): every conv is a depthwise-separable conv. The design choice that made MobileNet possible a year later. Variants: Xception (21.9M, paper-exact at 22M), tiny fixture. Residual skips around each block-of-three-sep-convs are implicit in the linear NetSpec.
def xception : NetSpec where
  name   := "Xception"
  imageH := 299
  imageW := 299
  layers := [
    -- Entry flow
    .convBn 3 32 3 2 .same,
    .convBn 32 64 3 1 .same,
    .separableConv 64 128 1, .separableConv 128 128 1,
    .maxPool 2 2,
    .separableConv 128 256 1, .separableConv 256 256 1,
    .maxPool 2 2,
    .separableConv 256 728 1, .separableConv 728 728 1,
    .maxPool 2 2,
    -- Middle flow: 8× (3 sep-convs + implicit residual), linearized
    .separableConv 728 728 1, .separableConv 728 728 1, .separableConv 728 728 1,
    .separableConv 728 728 1, .separableConv 728 728 1, .separableConv 728 728 1,
    .separableConv 728 728 1, .separableConv 728 728 1, .separableConv 728 728 1,
    .separableConv 728 728 1, .separableConv 728 728 1, .separableConv 728 728 1,
    .separableConv 728 728 1, .separableConv 728 728 1, .separableConv 728 728 1,
    .separableConv 728 728 1, .separableConv 728 728 1, .separableConv 728 728 1,
    .separableConv 728 728 1, .separableConv 728 728 1, .separableConv 728 728 1,
    .separableConv 728 728 1, .separableConv 728 728 1, .separableConv 728 728 1,
    -- Exit flow
    .separableConv 728 728  1,
    .separableConv 728 1024 1,
    .maxPool 2 2,
    .separableConv 1024 1536 1,
    .separableConv 1536 2048 1,
    .globalAvgPool,
    .dense 2048 1000 .identity
  ]
DenseNet (Bestiary/DenseNet.lean)
Two new primitives (.denseBlock, .transitionLayer). DenseNet (Huang et al. 2017, arXiv:1608.06993) takes the ResNet bypass idea to its concatenative extreme: every layer in a “dense block” reads the channel-wise concatenation of all preceding layers’ outputs. Each layer adds only growth_rate new channels (32 in the paper), so the per-layer parameter count stays small while feature reuse compounds. Table 11-5 is the variants.
|
Name |
Block counts |
Params |
|
DenseNet-121 |
(6, 12, 24, 16) |
7.0M |
|
DenseNet-169 |
(6, 12, 32, 32) |
12.5M |
|
DenseNet-201 |
(6, 12, 48, 32) |
18.1M |
These specs end in a 10-class (Imagenette) classifier, so they sit below the paper’s 1000-class models by that layer. Plus a tiny fixture for testing.
The dense connectivity pattern doesn’t fit a linear NetSpec at the sub-layer granularity (each sub-layer reads a growing concatenation of its predecessors), so the block is bundled as a shape-only primitive Layer.denseBlock ic growth_rate n_layers alongside Layer.transitionLayer ic oc (BN + 1\(\times \)1 conv + 2\(\times \)2 avg-pool, halves channels and spatial between blocks). Same modeling trick we use for mambaBlock, swinStage, evoformerBlock — the architectural novelty is inside the bundled op.
def denseNet121 : NetSpec where
  name   := "DenseNet-121"
  imageH := 224
  imageW := 224
  layers := [
    .convBn 3 64 7 2 .same,                       -- stem 7×7 stride 2
    .maxPool 3 2,                                  -- 3×3 stride 2 → 56×56
    .denseBlock 64 32 6,                           -- → 256 channels
    .transitionLayer 256 128,                      -- → 128 @ 28×28
    .denseBlock 128 32 12,                         -- → 512 channels
    .transitionLayer 512 256,                      -- → 256 @ 14×14
    .denseBlock 256 32 24,                         -- → 1024 channels
    .transitionLayer 1024 512,                     -- → 512 @ 7×7
    .denseBlock 512 32 16,                         -- → 1024 channels
    .globalAvgPool,
    .dense 1024 10 .identity
  ]
The pedagogical hook: DenseNet sits next to ResNet historically (2017 vs 2015) but architecturally generalizes the bypass primitive — ResNet’s \(y = f(x) + x\) becomes \(y_i = f_i([y_0, \ldots , y_{i-1}])\). The cost: activation memory grows quadratically in block depth from the concatenation. Modern CNN architectures (EfficientNet, ConvNeXt) took the per-layer-parameter-efficiency lesson but dropped the all-pairs concatenation in favor of standard residual paths.
ShuffleNet (Bestiary/ShuffleNet.lean)
One new primitive (§ 153). Grouped 1\(\times \)1 convs + channel shuffle (Zhang et al. 2017, arXiv:1707.01083). Variants: ShuffleNet 0.5\(\times \) / 1.0\(\times \) / 2.0\(\times \) at \(g=3\), plus a tiny fixture.
def shuffleNet1x : NetSpec where
  name   := "ShuffleNet 1.0× (g=3)"
  imageH := 224
  imageW := 224
  layers := [
    .convBn 3 24 3 2 .same,                     -- stem
    .maxPool 2 2,
    .shuffleBlock 24  240 3 4,                  -- stage 2
    .shuffleBlock 240 480 3 8,                  -- stage 3
    .shuffleBlock 480 960 3 4,                  -- stage 4
    .globalAvgPool,
    .dense 960 1000 .identity
  ]
ShuffleNet v2 (Bestiary/ShuffleNetV2.lean)
One new primitive (§ 154). The efficient-CNN paper (Ma et al. 2018, arXiv:1807.11164) that called out FLOPs as a bad latency proxy: measured memory-access cost (MAC) directly and derived four practical guidelines (equal channel widths, avoid grouped convs, avoid fragmentation, avoid element-wise ops). v2’s architecture throws out everything in v1 that violated those rules — no grouped 1\(\times \)1 convs, no skip-add — in favor of channel-split + identity + concat + channel-shuffle. Variants: 0.5\(\times \) (1.37M, paper 1.4M), 1.0\(\times \) (2.29M, paper 2.3M), 1.5\(\times \) (3.52M, paper 3.5M), 2.0\(\times \) (7.41M, paper-exact), tiny fixture. All widths within 2% of paper.
def shuffleV2_1_0 : NetSpec where
  name   := "ShuffleNet v2 1.0×"
  imageH := 224
  imageW := 224
  layers := [
    .convBn 3 24 3 2 .same,                     -- stem
    .maxPool 2 2,
    .shuffleV2Block  24 116 4,                  -- stage 2
    .shuffleV2Block 116 232 8,                  -- stage 3
    .shuffleV2Block 232 464 4,                  -- stage 4
    .convBn 464 1024 1 1 .same,                 -- 1×1 head conv→BN→ReLU (Conv5)
    .globalAvgPool,
    .dense 1024 1000 .identity
  ]
MobileViT (Bestiary/MobileViT.lean)
One new primitive (§ 155); reuses existing invertedResidual for the MV2 stages. Hybrid mobile backbone (Mehta & Rastegari 2022, arXiv:2110.02178): MobileNet V2 body with MobileViT blocks replacing some of the deeper inverted-residual stages. Variants: MobileViT-S (5.6M, paper-exact), XS (2.3M), XXS (1.3M), tiny fixture.
def mobileViTS : NetSpec where
  name   := "MobileViT-S"
  imageH := 256
  imageW := 256
  layers := [
    .convBn 3 16 3 2 .same,                     -- stem
    .invertedResidual 16 32 4 1 1,              -- stage 1: MV2
    .invertedResidual 32 64 4 2 3,              -- stage 2: 3× MV2 + downsample
    -- Stage 3: MV2 downsample + MobileViT (d=144, L=2)
    .invertedResidual 64 96 4 2 1,
    .mobileVitBlock 96 144 4 288 2,
    -- Stage 4: MV2 downsample + MobileViT (d=192, L=4)
    .invertedResidual 96 128 4 2 1,
    .mobileVitBlock 128 192 4 384 4,
    -- Stage 5: MV2 downsample + MobileViT (d=240, L=3)
    .invertedResidual 128 160 4 2 1,
    .mobileVitBlock 160 240 4 480 3,
    .convBn 160 640 1 1 .same,                  -- 1×1 expansion conv→BN→ReLU
    .globalAvgPool,
    .dense 640 1000 .identity
  ]
Swin Transformer (Bestiary/SwinT.lean)
Two new primitives (§ 156, § 157). Variants: Swin-T / -S / -B / tiny. Swin-T lands at 28.6M params against the paper’s 28M (Liu et al. 2021, arXiv:2103.14030) exactly.
def swinT : NetSpec where
  name   := "Swin-T"
  imageH := 224
  imageW := 224
  layers := [
    .patchEmbed 3 96 4 3136,                    -- 56×56 patches, dim 96
    .swinStage 96 3 384 7 2,                    -- stage 1: 2 blocks
    .patchMerging 96 192,                       -- 56×56×96 → 28×28×192
    .swinStage 192 6 768 7 2,                   -- stage 2: 2 blocks
    .patchMerging 192 384,                      -- 28×28×192 → 14×14×384
    .swinStage 384 12 1536 7 6,                 -- stage 3: 6 blocks
    .patchMerging 384 768,                      -- 14×14×384 → 7×7×768
    .swinStage 768 24 3072 7 2,                 -- stage 4: 2 blocks
    .globalAvgPool,
    .dense 768 1000 .identity
  ]
11.2 Object detection — demo: R34+FPN on VisDrone
Localize and classify. Detection heads are where the linear NetSpec shape starts to creak: multi-scale FPN outputs need a graph, not a list. The bestiary entries show the single-scale view and defer the multi-head refactor to the limitations discussion.
The working detector.
A ResNet-34 backbone, trained by this stack on ImageNet, feeding an FPN top-down neck into three anchor heads at strides \(8/16/32\); DIoU box loss, focal objectness, focal class CE; \(448\) px input, 30 epochs, photometric and box-aware scale augmentation. VisDrone is the harder half of detection: drone-altitude imagery where a median image holds seventy objects and many are \(2\)–\(5\) px after the resize — the regime where a single coarse grid structurally cannot emit the objects, and what makes the multi-scale head of Definition 160 necessary rather than decorative. Scored against VisDrone’s uncapped validation ground truth — all \(38{,}759\) boxes, not the 56-box-truncated training record, which drops \(34.9\% \) of them and is not the benchmark’s protocol. The catalog entry below keeps the paper-exact YOLOv1 shape for the historical record; Table 11-6 is the trained detector beside it, and Figure 11-1 is its top row on four validation frames.
|
recall |
class-agnostic AP |
||
|
R34+FPN, 30 ep, +scale aug |
0.2363 |
0.769 |
0.487 |
|
R34+FPN, 12 ep, +photometric aug |
0.1961 |
0.749 |
0.441 |
|
R34+FPN, 50 ep, +photometric aug |
0.1674 |
0.703 |
0.429 |
|
R34+FPN, 12 ep, no aug |
0.1526 |
0.682 |
0.393 |
|
R34+FPN, 50 ep, no aug |
0.1243 |
0.669 |
0.369 |
|
PyTorch replica, same architecture |
0.1532 |
0.677 |
0.400 |
|
YOLOv8s, matched budget |
0.140 |
— |
— |
|
YOLOv8s, 100 ep, 640 px, full aug |
0.391 |
0.400 |
— |
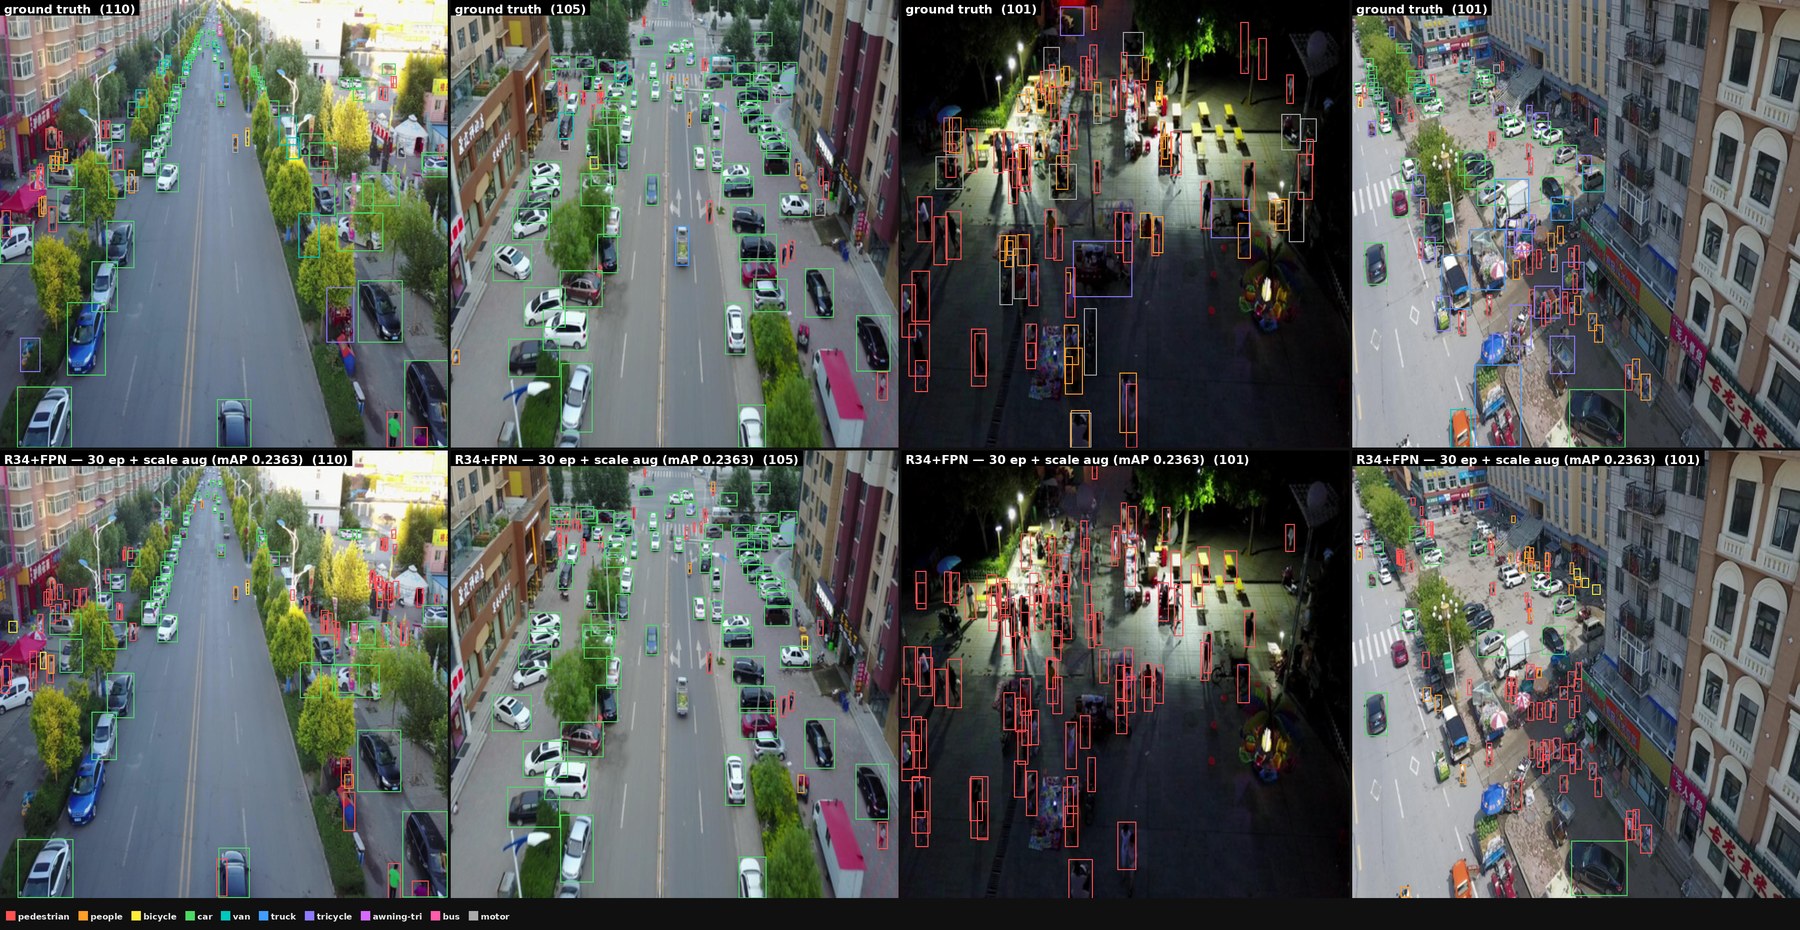
Augmentation and schedule length are one decision, not two, and the top five rows only mean something together. Quadrupling the schedule with augmentation off costs \(19\% \) — ordinary overfitting on \(6{,}471\) images. Photometric augmentation recovers it, but at that strength 12 epochs still beats 50. Augmentation that changes object scale inverts the ordering again: it makes 30 epochs worth \(44\% \) more than 12. A stronger augmentation needs a longer schedule to absorb, so the optimum epoch count is a property of the augmentation pack — there is no schedule that can be tuned once and carried across packs.
The mean hides where detection fails. Per-class AP runs from car down to bicycle, a spread of \(19\times \), and scale augmentation narrowed it from \(43\times \) by lifting exactly the classes that were worst: awning-tricycle by \(59\% \), bicycle by \(41\% \), tricycle by \(40\% \), against car’s \(7\% \). That the fix was data rather than objective is the substantive point. Reweighting a loss toward rare classes buys their recall at the expense of precision, and average precision charges for the trade; supplying the scales the rare classes are missing raises both at once, which is what the recall and class-agnostic AP columns move together to show. Detection on aerial imagery does not degrade uniformly — it collapses on whatever is simultaneously small and rare, and an averaged mAP is precisely the statistic that hides it.
The stack beats the hand-written PyTorch replica of this same architecture by \(54\% \), and runs at 65 fps on one RTX 4060 Ti — or \(55.9\) fps on a 25 W Jetson Orin Nano under TensorRT, with a uint8 input path and the clocks pinned. The replica, not YOLOv8, is the yardstick: it isolates implementation quality from architecture, which a comparison against a different model would conflate. The two YOLOv8s rows say something more interesting than either alone. At a matched budget it scores \(0.140\) — below this detector, though from random weights rather than an ImageNet-pretrained backbone — while its ordinary-practice \(0.391\) comes from \(8\times \) the epochs, higher resolution, full augmentation and COCO pretraining. The distance to the field is recipe, not architecture, and one item of that recipe closes \(31\% \) of it.
YOLO v1/v3/v5/v8/v11 (Bestiary/YOLO.lean)
v1 (Redmon et al. 2016, arXiv:1506.02640) uses zero new primitives (conv2d + maxPool + flatten + dense; the YOLO-ness lives in the loss and output reshape, not the architecture). v3 adds § 158 for the Darknet-53 body. v5/v8/v11 use § 159 for their CSPDarknet backbones. Variants: YOLOv1 (271M, paper-exact; the first FC’s fan-in is pinned to the paper’s \(7 \cdot 7 \cdot 1024\), while the spec’s own body ends at \(28 \times 28\)), fast, tiny, YOLOv3 (40M backbone), YOLOv5s/m (3M/8M single-scale), YOLOv8n/s (0.7M/2.9M single-scale), YOLOv11n/m (backbone only). Multi-scale FPN detection heads don’t linearize — same skip-connection problem as UNet; all entries show a single-scale view.
def yolo : NetSpec where
  name   := "YOLOv1 (Redmon 2016)"
  imageH := 448
  imageW := 448
  layers := [
    .conv2d 3 64 7 .same .relu,
    .maxPool 2 2,
    .conv2d 64 192 3 .same .relu,
    .maxPool 2 2,
    -- Block 3: 1×1 reduce + 3×3 expand
    .conv2d 192 128 1 .same .relu,
    .conv2d 128 256 3 .same .relu,
    .conv2d 256 256 1 .same .relu,
    .conv2d 256 512 3 .same .relu,
    .maxPool 2 2,
    -- Block 4: four 1×1+3×3 pairs, then 1×1 + 3×3
    .conv2d 512 256 1 .same .relu, .conv2d 256 512 3 .same .relu,
    .conv2d 512 256 1 .same .relu, .conv2d 256 512 3 .same .relu,
    .conv2d 512 256 1 .same .relu, .conv2d 256 512 3 .same .relu,
    .conv2d 512 256 1 .same .relu, .conv2d 256 512 3 .same .relu,
    .conv2d 512 512 1 .same .relu,
    .conv2d 512 1024 3 .same .relu,
    .maxPool 2 2,
    -- Block 5: two 1×1+3×3 pairs + two more 3×3 convs
    .conv2d 1024 512 1 .same .relu, .conv2d 512 1024 3 .same .relu,
    .conv2d 1024 512 1 .same .relu, .conv2d 512 1024 3 .same .relu,
    .conv2d 1024 1024 3 .same .relu,
    .conv2d 1024 1024 3 .same .relu,
    -- Block 6: two 3×3 at 7×7
    .conv2d 1024 1024 3 .same .relu,
    .conv2d 1024 1024 3 .same .relu,
    -- Head: flatten + 2 FC → reshape to (7, 7, 2·5 + 20) = 1470
    .flatten,
    .dense (7 * 7 * 1024) 4096 .relu,
    .dense 4096 yoloHeadSize .identity   -- 7 * 7 * (2 * 5 + 20)
  ]
Mask R-CNN (Bestiary/MaskRCNN.lean)
One new primitive (§ 160); the .bottleneckBlock backbone is Chapter 5’s ResNet-50. The canonical two-stage detector + instance segmentation reference (He et al. 2017, arXiv:1703.06870). Five architectural pieces: ResNet-FPN backbone, RPN for anchor-box proposals, ROI-Align for per-proposal feature extraction (an orchestration step, not a layer), a 2-layer FC box head for classification + bbox regression, and a 4-conv + transposed-conv mask head for per-class \(28 \times 28\) masks. Shown as separate NetSpecs per head (SAM-style decomposition). Param totals: backbone+FPN 45.8M, box head 14.3M, mask head 2.6M, RPN 0.6M — \(\sim \)63M in total, matching paper. The FPN cross-scale add is the one thing that demanded a new bundled primitive; everything else reuses existing ResNet / conv / dense primitives. DETR is its end-to-end transformer-era cousin; Mask2Former is the DETR-style instance-segmentation successor.
def maskRCNNBackboneR101 : NetSpec where
  name   := "Mask R-CNN backbone (ResNet-101-FPN)"
  imageH := 800
  imageW := 800
  layers := [
    -- ResNet-101 stem + body (C2..C5)
    .convBn 3 64 7 2 .same,
    .maxPool 3 2,
    .bottleneckBlock 64   256  3  1,            -- C2
    .bottleneckBlock 256  512  4  2,            -- C3
    .bottleneckBlock 512  1024 23 2,            -- C4
    .bottleneckBlock 1024 2048 3  2,            -- C5
    -- FPN: combines C2–C5 into a 4-level feature pyramid at 256 channels
    .fpnModule 256 512 1024 2048 256
  ]
DETR (Bestiary/DETR.lean)
Two new primitives (§ 161, § 162; Carion et al. 2020, arXiv:2005.12872); reuses existing bottleneckBlock (ResNet backbone), patchEmbed (absorbs the DETR 1\(\times \)1 channel reduce), and transformerEncoder. Variants: DETR-R50 (41M, paper-exact), DETR-R101 (60M), tiny.
def detrR50 : NetSpec where
  name   := "DETR-R50"
  imageH := 800
  imageW := 800
  layers := [
    -- ResNet-50 backbone (stem + 4 stages)
    .convBn 3 64 7 2 .same,
    .maxPool 2 2,
    .bottleneckBlock 64 256 3 1,                -- C2
    .bottleneckBlock 256 512 4 2,               -- C3
    .bottleneckBlock 512 1024 6 2,              -- C4
    .bottleneckBlock 1024 2048 3 2,             -- C5
    -- Channel projection (2048→256) + flatten spatial + pos embed
    .patchEmbed 2048 256 1 625,                 -- 25×25 = 625 tokens
    .transformerEncoder 256 8 2048 6,           -- 6 encoder blocks, 8 heads
    .transformerDecoder 256 8 2048 6 100,       -- 6 decoder blocks, 100 queries
    .detrHeads 256 91                           -- class (→92) + box (→4)
  ]
11.3 Industrial inspection — demo: the same detector on NEU-DET steel defects
The detector of the previous section, unchanged — backbone, neck, heads, loss, ImageNet bootstrap, scorer — on the dataset the industrial-inspection literature reports on. NEU-DET (Song & Yan 2013; boxes He et al. 2020) is \(1{,}800\) grayscale \(200\times 200\) crops of hot-rolled steel strip, \(300\) per class over six defect types — crazing, inclusion, patches, pitted surface, rolled-in scale, scratches — with Pascal-VOC boxes. It is VisDrone’s opposite regime. A crop holds \(2.3\) defects, half of which span more than half the frame; at the detector’s \(448\) px input, \(98\% \) of the training boxes route to the coarsest pyramid level and none to the finest. This is the dataset on which a single \(14\times 14\) grid should not collapse, and running both heads on both datasets is what shows when multi-scale detection pays.
Three constants change and nothing in the code generation does: the anchor priors are re-fitted to NEU’s boxes (VisDrone’s largest is \(0.18\times 0.15\) of the frame; a steel defect is often half of it), the class weights are off (the data is balanced), and the six classes take ids \(0\)–\(5\) of the ten-slot one-hot, since the \(5+10\) per-anchor width is baked into the fpnDetect emitter and the scorer averages over the classes present. NEU-DET ships no split; the one here is \(1{,}080/360/360\), stratified \(180/60/60\) per class from a fixed seed. Epochs are chosen on the validation \(360\) and the numbers in Table 11-7 are the test \(360\) at that epoch, scored by the VisDrone protocol against uncapped ground truth. The single-grid arm is the same ResNet-34 and the same bootstrap under a one-grid YOLOv1 head at \(448/14\), run for the same 30 epochs. Table 11-8 is the same two heads on VisDrone, and Figure 11-2 is both on one crop of each defect.
|
NEU-DET test |
recall |
class-agnostic AP |
|
|
R34+FPN, the VisDrone recipe (e28) |
0.623 |
0.992 |
0.625 |
|
R34+FPN, photometric augmentation off (e30) |
0.630 |
0.987 |
0.640 |
|
R34+FPN, no ImageNet bootstrap (e26) |
0.555 |
0.986 |
0.555 |
|
R34, single \(14\times 14\) grid (e28) |
0.607 |
0.917 |
0.609 |
|
published stock detectors, \(640\) px, 300 ep |
0.73–0.78 |
— |
— |
|
published improved variants |
\(\approx 0.83\) |
— |
— |
|
VisDrone val, the same two heads |
recall |
class-agnostic AP |
|
|
R34+FPN, 30 ep, +scale aug |
0.2363 |
0.769 |
0.487 |
|
R34, single \(14\times 14\) grid, 12 ep |
0.0391 |
0.184 |
0.107 |
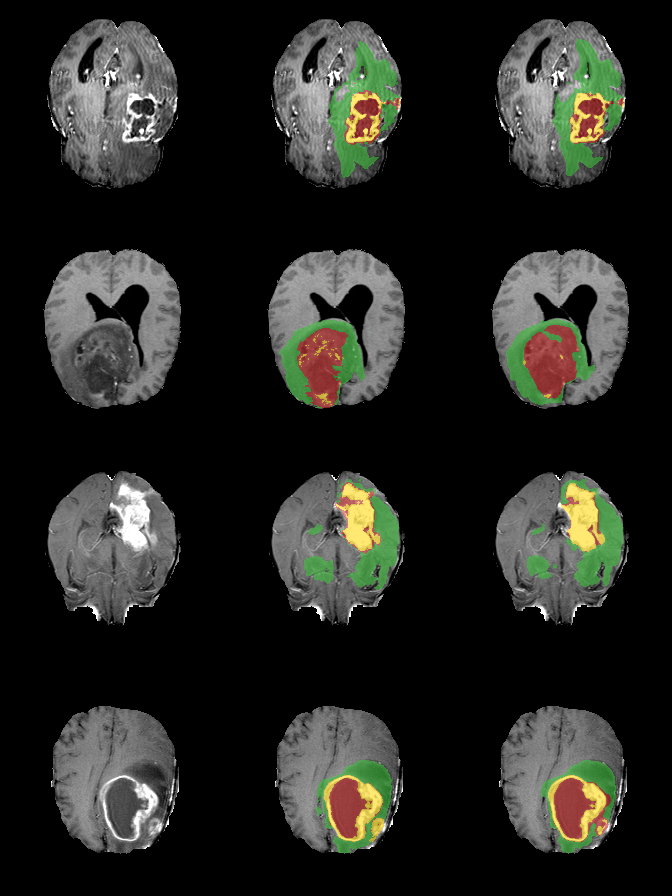
Table 11-8 is the result. On steel the single grid matches the multi-scale head, \(0.607\) against \(0.623\); on drones it is six times behind, \(0.039\) against \(0.236\), with recall \(0.18\) against \(0.77\) — same backbone, same bootstrap, same scorer, same lowerer in all four cells. The FPN pays for itself only where objects are small; on NEU-DET it runs three heads for one level’s worth of work, and the head that collapses on VisDrone is not wrong, it is wrong for drones. Recall is not the limit on steel: the FPN finds \(99\% \) of defects and the mean is held down by two classes, crazing at \(0.29\) and rolled-in scale at \(0.41\) against \(0.66\)–\(0.84\) for the other four — the diffuse textures whose “box” is most of the crop, the worst two in every published NEU-DET table and the worst two for both heads here. The ImageNet prefix is worth \(+0.07\) at \(1{,}080\) training images, a gap that has not closed by epoch 30. Photometric augmentation’s \(+0.007\) is one run against one run; no seed spread has been measured on this detector, so it is not a result in either direction.
The distance to the published rows is recipe. Those detectors run at \(640\) px for 300 epochs on a \(1{,}440/180/180\) split; this one runs at \(448\) px for 30 epochs, which on \(1{,}080\) images is \(4{,}050\) steps against VisDrone’s \(24{,}000\), and both arms are still rising at epoch 30. The anchor priors are a second, smaller part of it: three per level fit a level that carries \(98\% \) of the boxes at every aspect from \(64\) px to the full frame at a mean IoU of \(0.52\), and the head has to regress the rest. Both are levers the detector already has; neither was pulled, because the comparison the section makes needs the detector to be the detector.
11.4 People watching — demo: Arabic sign-language letters on ArASL
Networks whose input is a person: a face, a gait, a hand. The demo is Chapter 4’s CIFAR net on the dataset the Arabic sign-language literature reports on, run twice on the same images — once under the split every published number uses, once under a split that keeps each hand’s frames together — and the pair of numbers is the result. ArASL (Latif et al. 2019, Data in Brief 23; Mendeley y7pckrw6z2, CC BY 4.0) is \(54{,}049\) grayscale \(64\times 64\) crops of static hand signs for the 32 letters of the Arabic alphabet, \(1{,}293\) to \(2{,}114\) per class, performed by “more than 40 people”. Published classifiers score \(96.6\)–\(97.6\% \) for CNNs trained from scratch (Latif et al. 2020; Alani & Cosma 2021; Abdelghfar et al. 2023) and \(99.3\)–\(99.6\% \) for transfer-learned EfficientNets and ViTs (Al Nabih et al. 2024; arXiv:2410.00681; arXiv:2501.08169), all on random splits. The images are video bursts: sorted by file number within a class, consecutive frames differ by a median \(3.3\) grey levels per pixel where a random pair of the same class differs by \(33\), and cutting where the gap exceeds \(6\) leaves \(14{,}336\) chains of \(3.8\) frames. No signer, session or date is recorded. The two protocols are \(80/10/10\) per class from one seed: random, a stratified permutation, and blocked, each class’s capture order cut at the \(80\% \) and \(90\% \) marks with each cut moved to the nearest chain boundary. An audit then measures what the split did: for every test image, the nearest training image of any class at \(16\times 16\). Under random, \(92.3\% \) of test images have a training image within \(6\) grey levels and \(95.7\% \) of those neighbours carry the test image’s own label; under blocked, \(6.4\% \) and \(28.6\% \). The residual \(6\% \) is the same hand returning a median \(306\) files later, which a release without signer ids cannot separate.
Two numbers change in the network and nothing in the code generation does. CIFAR-CNN8-wide-BN as Chapter 4 spells it — eight convolutions in four conv-conv-pool stages at 16, 16, 32, 32 channels into the \(2\times 512\) head — takes a one-channel stem and a 32-way output; on the native \(64\times 64\) input the four pools end at \(4\times 4\), so the flatten is \(512\) wide and the net is \(0.58\) M parameters. The recipe is the gravitational-wave demo’s, unchanged: the ordinary train step with integer labels, Adam at \(10^{-3}\) with one warm-up epoch and cosine decay, batch 64, 30 epochs, no flip (a mirrored hand is a different sign for some letters), five minutes on one card. The chapter’s linear and MLP rungs run through the same loop as the bracket, and the chapter net at its own \(32\times 32\) input checks that the resolution is not the story. Epochs are chosen on the validation tenth and the numbers in Table 11-9 are the test tenth at that epoch, three seeds for the chapter net, with a \(95\% \) Wilson interval on the pooled \(\approx 16{,}200\) trials of \(\pm 0.2\) (random) and \(\pm 0.6\) (blocked). Figure 11-3 is the alphabet, the nearest neighbours under each split, and the confusions.
|
ArASL test, 80/10/10 per class |
random split |
blocked split |
|
|
CIFAR-CNN8-wide-BN, \(64\times 64\), 3 seeds |
98.62 \(\pm \) 0.10 |
77.94 \(\pm \) 0.80 |
the demo |
|
with a near-duplicate in train |
99.73 |
98.46 |
\(92.3\% \) / \(6.4\% \) of the test tenth |
|
without |
85.26 |
76.53 |
\(7.7\% \) / \(93.6\% \) |
|
CIFAR-CNN8-wide-BN at \(32\times 32\) |
98.21 |
71.03 |
the chapter’s own input |
|
MLP \(4096\)-\(512\)-\(512\)-\(32\) |
94.86 |
42.09 |
what convolutions buy |
|
linear \(4096\)-\(32\) |
53.20 |
15.37 |
the floor |
|
1-NN on \(16\times 16\) thumbnails |
95.65 |
28.60 |
nearest training image’s label |
|
published CNNs, from scratch |
96.6–97.6 |
— |
2020–23 |
|
published transfer / transformer |
99.3–99.6 |
— |
ViT, EfficientNet-B2, 2024–25 |
The two columns are the result. Under the literature’s protocol the chapter net scores \(98.6\% \), above every published from-scratch CNN and a point under the transfer-learned transformers; under the blocked split the same net, recipe and seeds score \(77.9\% \). The audit says where the twenty points went. Nine in ten random-split test images have a training image within six grey levels, and on those the net is at \(99.7\% \); on the \(416\) that do not it is \(85.3\% \); and a nearest-neighbour lookup on \(16\times 16\) thumbnails — no parameters, the training image’s label — scores \(95.7\% \) on the random split and \(28.6\% \) on the blocked one. The published \(96\)–\(99\% \) is mostly the frame, not the hand. The bracket says the same thing from below: the linear classifier loses \(38\) points between the columns and the MLP \(53\), because a pixel-space model can only memorise the hand it saw, and the convolutions lose \(21\), which is the part of the letter they read. The chapter net at its own \(32\times 32\) input loses half a point on the random split and seven more on the blocked one — the difference between hands lives at a resolution the difference between frames does not need. Per class, the blocked column runs from \(16.5\% \) (fa) to \(100\% \) (sheen): the last tenth of some classes’ capture order is a hand no training frame covers, and the classes farthest from their nearest training image are among the worst, but not all the far ones fail — al and seen sit as far from training as fa does and score \(94\% \) and \(100\% \). The rest is which letter the new hand’s shape lands near: fa is called gaaf \(181\) times in three runs and gaaf is called fa once, and taa and thaa, which differ by one raised finger, confuse in both directions.
Two caveats belong beside the number. The blocked split is a proxy for a signer split, not one: the release records no signer, the validation tenth sits next to the training tenths in capture order and is \(37.5\% \) leaked against the test tenth’s \(6.4\% \) (every blocked run shows validation near \(92\% \) and test near \(78\% \), and the epoch is chosen on the leakier of the two), and the \(6\% \) of test hands that return from earlier in the numbering is a floor the protocol cannot remove. And what this classifier is not: it reads one static handshape per frame — fingerspelling, no motion, no grammar, no continuous signing — and the honest number for even that task on new hands is the right-hand column.
11.5 Agriculture — demo: lab leaves to field leaves on PlantVillage and PlantDoc
Networks that look at crops. The demo trains a leaf-disease classifier on the dataset the agriculture literature uses most, reproduces its famous number, and then asks the two questions that number does not answer: what does the same net score on a photograph taken in a field, and what was it looking at.
The data. PlantVillage (Hughes & Salathé 2015; Mohanty, Hughes & Salathé 2016; CC BY-SA 3.0) is \(54{,}305\) photographs of single picked leaves laid on a grey background in a laboratory: 38 classes over 14 crops — apple scab, tomato early blight, corn rust, grape black rot, and the healthy leaf of each crop. Published classifiers score \(99\)–\(99.7\% \) on a random split of it. PlantDoc (Singh et al. 2020; CC BY 4.0) is \(2{,}578\) photographs of the same crops and diseases taken where they grow — leaves on the plant, several per frame, soil and sky behind them, phone lighting — in 28 classes that all map onto PlantVillage’s. The net here is Chapter 5’s ResNet-34 from its ImageNet weights with a 38-way head, ten epochs on PlantVillage, forty minutes on one card; PlantDoc is never seen in training except by the last two rows of Table 11-10, which learn from it five-fold and are scored only on field images they did not train on. (A near-duplicate audit of PlantVillage finds none, and the maintainers’ own leaf-grouped split gives the same number as a random one; whatever the lab number hides, it is not a repeated frame.)
|
PlantVillage test |
PlantDoc, all \(2{,}578\) |
||
|
ResNet-34, ImageNet prefix, 3 seeds |
99.57 \(\pm \) 0.06 |
17.80 \(\pm \) 1.77 |
the demo |
|
the same, random split |
99.72 |
16.56 |
the papers’ split |
|
the same, from scratch |
99.07 |
11.60 |
what ImageNet buys |
|
+ leaves on Imagenette backgrounds, 3 seeds |
99.44 \(\pm \) 0.15 |
21.48 \(\pm \) 1.25 |
the diagnosis, attacked |
|
+ photometric/geometric augmentation |
99.62 |
19.24 |
the modern recipe |
|
+ 250 field labels, five-fold |
— |
22.69 |
ten per class |
|
+ all field labels, five-fold |
— |
45.00 |
\(2{,}062\) per fold |
|
+ backgrounds, then 250 / all field labels |
— |
26.57 / 42.05 |
stack at few labels only |
|
published, PlantVillage random split |
99.35 |
— |
Mohanty et al. 2016 |
|
published, on images from elsewhere |
— |
\(\approx 31\) |
Mohanty et al. 2016 |
The first two columns are the result. The net that scores \(99.6\% \) in the laboratory scores \(18\% \) in the field (\(2{,}578\) images, 28 classes, chance \(3.6\% \)). Nothing was wrong with the training; the distribution was. The rest of the section asks the net what it learned, with three instruments that need only the trained weights and the leaf mask PlantVillage ships with every image. Table 11-11 is what they find.
|
What the trained net is asked, PlantVillage test (\(10{,}709\)) |
base |
+ backgrounds |
|
the test leaves as photographed |
99.6 |
99.4 |
|
the same leaves on a black background |
60 |
96 |
|
the leaf on its own median background colour |
94 |
99 |
|
the background only, leaf filled with that colour (chance 2.6) |
25 |
14 |
|
a flat image of that colour and nothing else |
4.4 |
2.6 |
|
Shapley value: share of the class evidence due to the leaf |
85% |
96% |
|
Shapley value: images where the background helps |
88% |
71% |
|
class-activation map: share of the map inside the leaf (uniform map: 59%) |
71% |
79% |
The upper rows are counterfactuals: the same test leaves, edited. The lower rows are the two explainers. The class-activation map is the usual heat map — the class’s weights applied to the last feature map — and the number is how much of its heat falls inside the leaf. The Shapley value treats the image as a game with two players, the leaf and the background, and asks how much of the class score each is responsible for; with two players it is exact from four forward passes (the image, the leaf alone, the background alone, neither), and the two shares add up to the whole score. Both explainers say the same reassuring thing: the evidence is the leaf, \(85\% \) of it. The counterfactuals say otherwise. Put the same leaf on black and the net loses forty points; show it the background with the leaf painted out and it is right one time in four; show it a flat rectangle of the background’s colour and it still beats chance. The background helps in nine images out of ten, a little each time. A map of where the evidence is heaviest does not say what the net cannot do without. Figure 11-4 is four test leaves under the maps, in the laboratory and in the field.
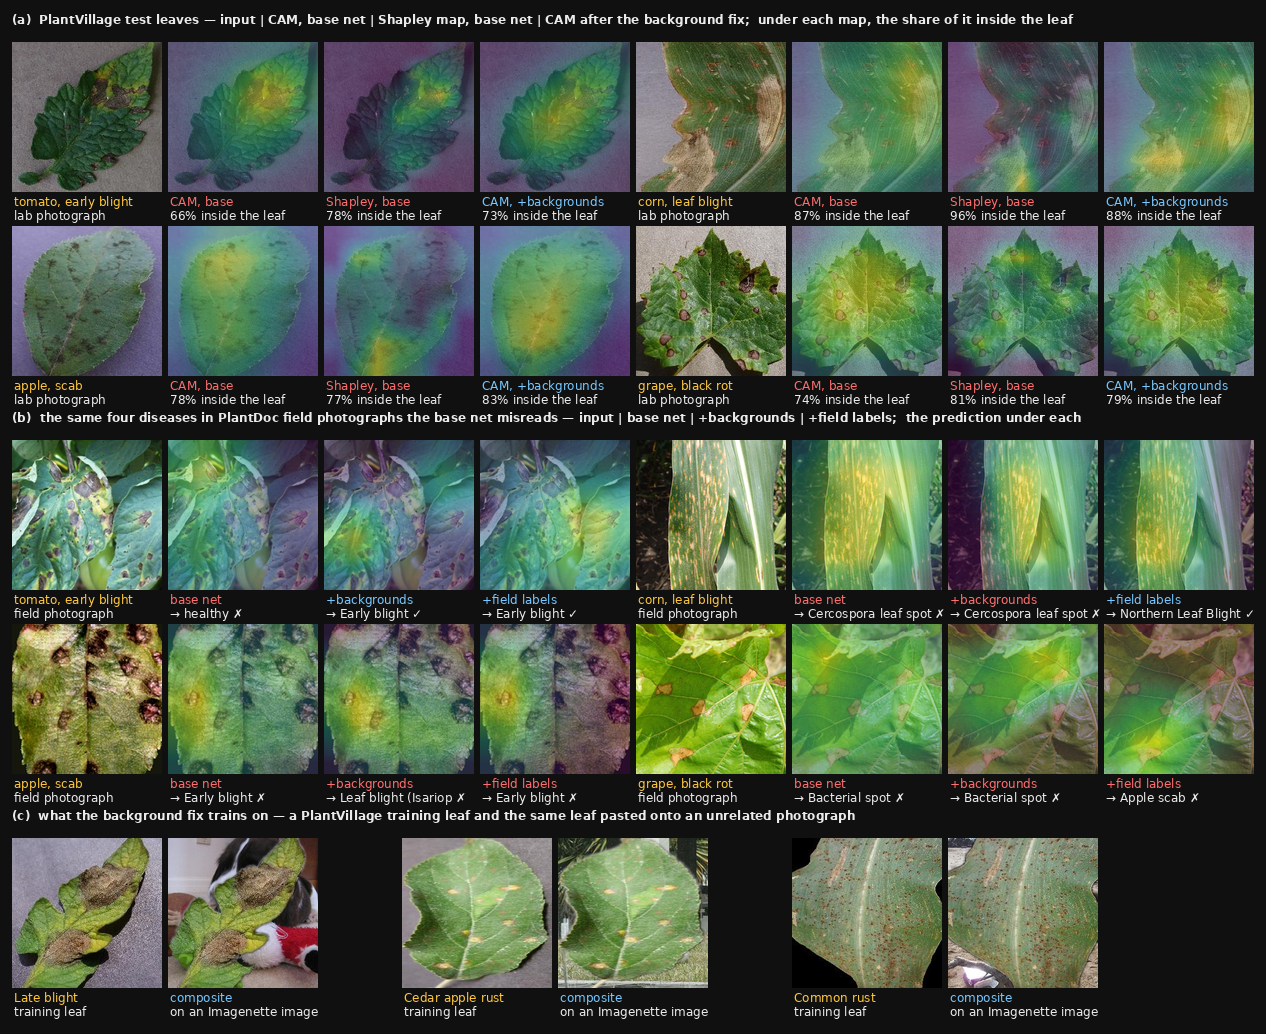
The fixes. Pasting every training leaf onto an unrelated photograph (the composites of panel c) attacks exactly what the table found, and repairs it: the leaves on black go from \(60\% \) to \(96\% \), the background alone falls toward chance, the leaf’s Shapley share rises to \(96\% \). In the field it buys three and a half points, \(17.8 \pm 1.8\) to \(21.5 \pm 1.3\) over three seeds each. Stronger augmentation — colour, rotation, erasing — changes none of the diagnostics and stays inside the seed noise. Field labels are what work: ten per class buy seven points, all two thousand buy twenty-seven, and the two fixes stack only while labels are scarce. The laboratory artefact is real and removable, and removing it is not what gets the net into the field.
What this classifier is not: a diagnosis. It reads one leaf at one moment — no severity, no spread across a field, no symptom before the lesion shows — and the honest number for even that, on a photograph a grower would take, is the right-hand column.
11.6 Remote sensing — demo: which wavelengths travel, EuroSAT to the Amazon and the Cerrado
Networks that look down. The demo trains the chapter-4 CNN on satellite chips whose input is not a photograph — thirteen bands of Sentinel-2, ten of them outside what a camera sees — five times, each time allowed a different part of the spectrum, and then asks the trained nets, unchanged, to read land they have never seen. Europe is a target that holds still. The Amazon’s arc of deforestation is a different place, and the Cerrado, read in September and again in March, is a place that moves; the question is which bands can follow it.
The data. EuroSAT (Helber et al. 2019; MIT) is \(27{,}000\) chips of Sentinel-2 imagery over 34 European countries, each \(64\times 64\) pixels at 10 m — a 640 m square — in all 13 bands from 443 to 2190 nm, in ten land-cover classes: annual crop, forest, herbaceous vegetation, highway, industrial, pasture, permanent crop, residential, river, sea or lake. A leaf is bright in the near infrared, where its spongy interior scatters the light that chlorophyll absorbs in the red, and dark in the short-wave infrared, where its water absorbs; the red edge is the step between the two. Colour-infrared film found camouflage on that principle in the 1940s, and the vegetation indices of the 1970s are ratios of exactly these bands. The Brazil chips were cut for this section (data appendix): the same 640 m squares from Sentinel-2 scenes of 2023 over Rondônia in June, and over western Bahia in September and again, the same \(3{,}620\) squares, in March, each labelled by majority vote from MapBiomas, Brazil’s 10 m land-cover map, through the seven classes EuroSAT’s ten collapse into (forest, pasture, herbaceous, annual crop, perennial crop, built, water). The Cerrado’s own class — savanna, woody and herbaceous at once, \(2{,}000\) chips — has no European name and is kept aside. The net is Chapter 4’s CIFAR CNN with the stem’s input channels as the only change: rgb (three bands), rgbn (plus near infrared), ms10 (the ten bands at 10 and 20 m), all (thirteen), and ir (red edge, near and short-wave infrared, and no visible light at all); 80 epochs with flips and rotations, three seeds, five minutes an arm on one card. Nothing in the codegen moves. Table 11-12 is the five arms at home and abroad.
|
EuroSAT |
Amazon |
Cerrado |
Cerrado |
same answer |
|
|
test |
June |
September |
March |
both seasons |
|
|
rgb |
97.1 \(\pm \) 0.1 |
87.4 \(\pm \) 0.9 |
33.2 \(\pm \) 0.5 |
37.7 \(\pm \) 0.3 |
38% |
|
rgbn |
98.0 \(\pm \) 0.1 |
89.3 \(\pm \) 1.4 |
34.6 \(\pm \) 0.6 |
39.0 \(\pm \) 0.5 |
41% |
|
ms10 |
98.4 \(\pm \) 0.1 |
97.0 \(\pm \) 0.6 |
32.8 \(\pm \) 2.3 |
59.2 \(\pm \) 0.5 |
27% |
|
all |
98.3 \(\pm \) 0.1 |
97.0 \(\pm \) 0.5 |
35.4 \(\pm \) 2.5 |
53.8 \(\pm \) 4.3 |
24% |
|
ir |
97.9 \(\pm \) 0.1 |
91.7 \(\pm \) 1.5 |
29.0 \(\pm \) 2.5 |
39.8 \(\pm \) 3.1 |
39% |
|
trained in Brazil, five-fold |
— |
rgb 94.2 \(\pm \) 0.7 all 95.8 \(\pm \) 0.6 |
— |
||
|
Helber et al. 2019, ResNet-50 |
98.6 |
— |
— |
— |
— |
The first column is the literature’s question and the second is the demo’s. In Europe the ten invisible bands are worth about a point to a small net trained from scratch, and the bands a camera cannot see are enough on their own (ir, 97.9); the published ordering — RGB 98.6, colour-infrared 98.3, short-wave infrared 97.1 — was the ImageNet pretraining, not the spectrum. In the Amazon the same bands are worth ten. Rondônia is forest and pasture; every arm finds the forest (\(99.8\% \) of it), and RGB loses a quarter of the pasture (\(74\% \) recall) where the ten-band arm keeps \(95\% \). Near infrared alone buys four of the ten points and the red edge and short-wave infrared buy the rest; the arm with no visible light at all reads 91.7.
The Cerrado is the harder question, twice. In September every arm falls to a third, and the confusion is one line of the matrix: a paddock in the dry season is “herbaceous vegetation” to a net that learned pasture from European meadows (RGB puts 666 of 884 there), and the biome’s own class, savanna, is “herbaceous” to all five arms. Merge herbaceous and pasture into one grass class and RGB reads 76; the multispectral arms 65 to 73, because they also send a share of the dry paddocks to “annual crop” — bare, dry ground is a ploughed field in the short-wave infrared. In March the same chips are green, the ten-band arm reads 59 and RGB 38, and savanna becomes “forest” to RGB on \(42\% \) of its chips. The last column is the check the section was built for, and it fails for every arm: the same \(3{,}620\) chips get the same answer in the two seasons between a quarter and two-fifths of the time. The multispectral arms are better in both seasons; they are not stabler. A Cerrado pasture’s red and short-wave reflectance doubles between March and September, and no European chip taught that.
Whose fault. Trained on the Brazil labels themselves, five-fold, the same net reads \(94.2\) with three bands and \(95.8\) with thirteen: the labels are learnable, and the thirteen-band margin over RGB is the same point and a half as in Europe. Fine-tuned from the European weights on 300 Brazilian labels, every arm recovers about 90, the thirteen-band arm a point more; on all of them the European start is worth nothing over scratch. A five-player Shapley value over band groups — visible, red edge, near infrared, short-wave infrared, and the three atmospheric bands at 60 m; a removed group set to its training mean, exact over 32 forward passes per chip — says where the thirteen-band net’s evidence came from: a third of it from visible light on either continent, the short-wave share rising from \(13\% \) at home to \(22\% \) abroad, and the atmospheric bands worth less than nothing in Brazil (\(-3.0\) nats of log-probability in the Amazon). They had learned Europe’s sky, which is why the arm without them travels best. Figure 11-5 is three of the Brazilian windows under three of the arms.
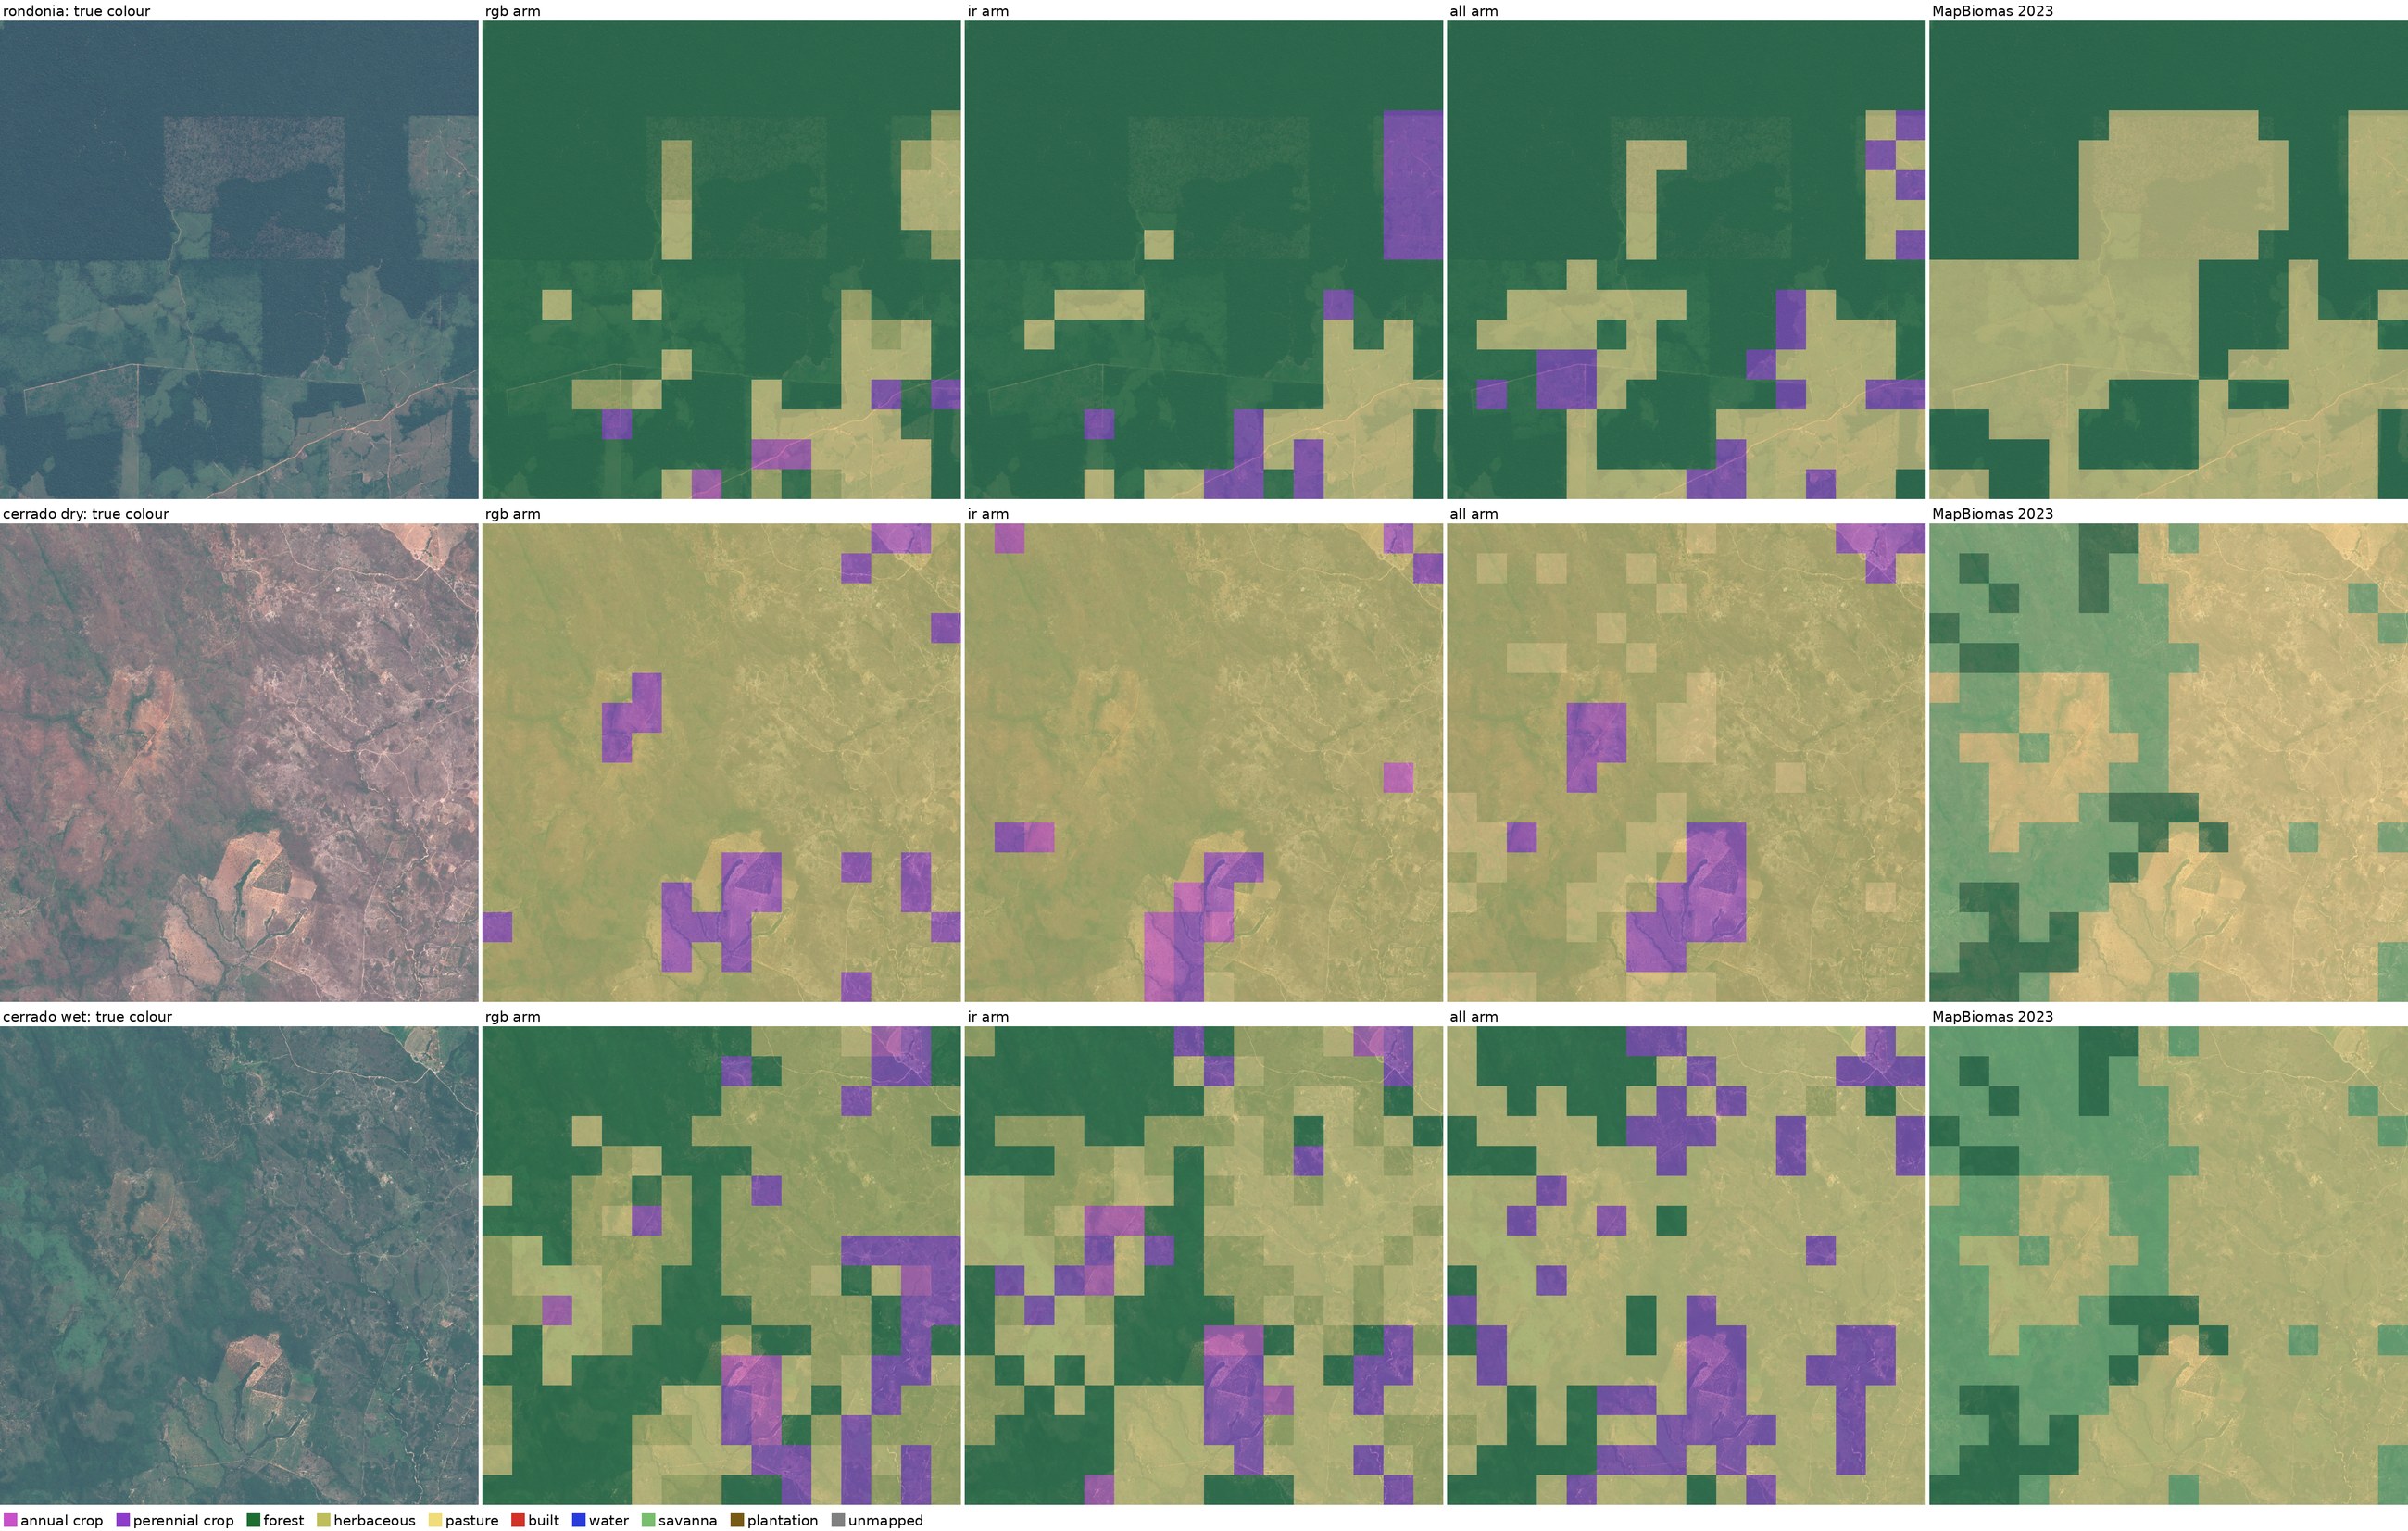
What travelled was the physics: the bands where a leaf’s structure and water are, which read the same over a Bavarian spruce stand and a Rondônia pasture, and carried a net trained on one to the other with no loss worth mentioning. What did not travel was the vocabulary. A class list written for one continent has no word for the other’s biome and a different word for its grass, and the season that turns that grass brown turns every one of these nets around with it. The first is a reason to keep the invisible bands; the second is a reason to label where you look.
What this classifier is not: a map. It says what a 640 m square mostly is — not where the boundary runs, when the forest was cut, or how much of it is gone. The Bahia chips are the first half of the instrument that could say the last two: the same square on two dates, and the difference between them.
11.7 Semantic segmentation — demo: UNet on BraTS
Pixel-level labeling. Symmetric encoder/decoder with skip connections is the recurring pattern; UNet is the canonical instance, and the same shape later became the diffusion-model backbone.
A ResNet-34 UNet on BraTS.
The demos/MainUnetBratsR34.lean trainer (unet-brats-r34) is a working encoder–decoder segmentation network at 24.5M params on MSD Task01 brain-tumour MRI: four co-registered modalities (FLAIR / T1w / T1gd / T2w) at \(224 \times 224\) in, four per-pixel classes out (background, edema, non-enhancing/necrotic core, enhancing tumour), 14,415 training slices from 411 patients with the 2,569 validation slices held out by patient. The tumour sub-regions are defined by which modality lights up — edema is bright on FLAIR, enhancing tumour on T1gd — so the input is genuinely multi-modal rather than three correlated views of one scene, and the classes are brutally imbalanced: enhancing tumour is \(\sim \)0.5% of voxels.
Scored on the clinical literature’s regions — Dice over the nested WT (whole tumour), TC (tumour core) and ET (enhancing tumour) — pooled over the 2,569 tumour-bearing validation slices, ten epochs of plain per-pixel cross-entropy gives:
|
mIoU |
WT |
TC |
ET |
|
|
ResNet-34 UNet (unet-brats-r34) |
0.741 |
0.910 |
0.867 |
0.856 |
Rendered predictions are Figure 11-6 — T1gd backdrop, ground truth, prediction, on four held-out patients. This matters more than the table for a segmentation demo: a model that has collapsed onto the majority class and one that works report similar pixel accuracy, because 97% of voxels are background. They do not produce similar pictures.
The encoder is the ResNet-34 of Ch 5, reused verbatim as the contracting path rather than a stack of .unetDowns; the decoder is four .unetUp stages, and the skips come off the backbone. The two codegen primitives this rests on — bilinear upsample (forward + VJP) and channel concat — are exposed at the Layer level as .unetDown and .unetUp, which the canonical bestiary UNet below also uses. Three things change relative to the image classifiers of Part 1:
The label is a tensor, not a scalar. Classifiers emit one logit vector per image (shape \(B \times K\)) and compare it to one ground-truth class. Segmentation networks emit one logit vector per pixel (shape \(B \times K \times H \times W\), with \(H \times W\) matching the input) and compare against a shape-identical ground-truth mask. Cross-entropy is computed per pixel, averaged spatially. This rides the same useSeg flag in TrainConfig that the NLP subsection’s TinyGPT uses for per-token loss, applied across the spatial axes instead of the token axis — no new VJP machinery; the per-pixel softmax-CE backward is the same one Ch 1 derived, fired \(HW\) times in parallel.
The network has to give spatial resolution back. A classifier downsamples aggressively (input \(224^2\), bottleneck \(7^2\), GAP, \(K\)-way logits) and discards spatial structure on purpose. A segmentation network downsamples and then upsamples, with skip connections from each encoder stage spliced into the matching decoder stage so the output recovers pixel-level detail the bottleneck threw away. That symmetry is exactly what .unetUp’s body bundles — bilinear upsample + channel concat with the saved skip + two convs — and it is the only architectural piece this section’s backbones add to the Part 1 kit.
Inference is one forward pass; post-processing differs. Segmentation doesn’t autoregress; one network call produces every pixel label simultaneously. What changes is what you do with the logits: argmax per pixel and render as a colored mask. The brats-predict executable is the smallest example of that path — same artifact the trainer produced, plus a small C colormap routine.
What the skips are worth, measured.
The second bullet above is the one claim in this subsection that is cheap to test rather than assert. Running the same backbone, data and schedule with the decoder’s skip connections removed — upsample and convolve, but never concatenate the encoder feature — isolates exactly what they contribute:
|
decoder |
mIoU |
WT |
TC |
ET |
|
upsample only (no skips) |
0.633 |
0.871 |
0.814 |
0.733 |
|
.unetUp (skips) |
0.741 |
0.910 |
0.867 |
0.856 |
Roughly ten points of mIoU, and the largest single gain is on ET (\(+0.12\)), the smallest and thinnest structure — which is what the bullet predicts, since a decoder without skips must reconstruct every boundary from a \(7 \times 7\) bottleneck. It is visible in the renders as well: the thin enhancing rim around the necrotic core is resolved with skips and smeared into the core without them.
Scored per patient.
Tables 11-13 and 11-14 pool every pixel of every tumour-bearing slice into one Dice. The literature does something else: one Dice per patient volume, over all of its slices including the tumour-free ones, then the mean over patients — so a small tumour counts as much as a large one, and the slices where there is nothing to paint count against a model that paints anyway. brats-eval (demos/MainBratsEval.lean) computes that from a whole-volume export of the 73 validation patients (preprocess_brats.py –val-full), and first re-derives the pooled number on the same slices, where it agrees with the trainer’s log line to \(0.0004\). Best-by-val checkpoints:
|
per-patient mean Dice (median) |
WT |
TC |
ET |
|
ResNet-34 UNet, ImageNet bootstrap |
0.893 (0.914) |
0.821 (0.867) |
0.790 (0.858) |
|
ResNet-34 UNet, from scratch |
0.889 (0.917) |
0.819 (0.869) |
0.783 (0.851) |
|
without skips |
0.843 (0.873) |
0.749 (0.801) |
0.620 (0.679) |
|
from-scratch UNet \(240^2\), Dice+CE, 3 ep |
0.882 (0.908) |
0.802 (0.850) |
0.782 (0.839) |
|
ResNet-34 UNet, 2.5D (\(\pm 1\) slice) |
0.893 (0.916) |
0.824 (0.868) |
0.788 (0.850) |
|
3D UNet, \(128^3\) patches, 20k steps (JAX) |
0.900 (0.918) |
0.827 (0.868) |
0.808 (0.867) |
Two things the pooled number hid. The tumour-free slices cost almost nothing: pooled over every slice the Dice is within \(0.003\) of the tumour-slice value, so the slice model does not paint tumour where there is none. And the per-patient mean sits two to seven points below the pooled number with a wide spread (standard deviations of \(0.07\) on WT to \(0.19\) on ET): the medians are at the pooled values, and the means are pulled down by a tail of small-tumour patients — which is what the per-patient protocol exists to expose. The skips are worth more per patient than per pixel, \(+0.17\) on ET against \(+0.12\). These are the numbers to put beside published BraTS work, with the remaining caveat that the 484-case MSD Task01 is not the 1,251-case BraTS 2021 set.
Through-plane context.
A slice model never sees the slice above or below. The last two rows measure what that costs, two ways. unet-brats-r34 ctx=1 is the same net with the two neighbouring slices fed in as eight extra input channels (a 2.5D build from preprocess_brats.py –context 1; the stem is the only tensor that changes, and the records, their order, the seed and the schedule are the 2D run’s): it ties the 2D anchor within \(0.004\) on every metric, pooled and per patient. At 1 mm spacing the neighbours are nearly the centre slice again, so this says adjacent slices add nothing the slice model cannot infer, not that volumetric context is useless. The direct test is a 3D UNet — this section’s UNet with \(3^3\) kernels and \(2^3\) pools, 23.5M parameters — trained in JAX on random \(128^3\) patches for 20,000 steps, a little over five hours on one card (jax/scripts/unet3d_brats.py, the reference a Lean rank-5 port would be tied to). In Table 11-15 its means are ahead of the anchor’s by under a point on WT and TC and by two on ET, and most of the ET gain is what a size threshold also buys. So Table 11-16 applies the usual BraTS post-process to every model — enhancing-tumour predictions under 200 voxels in a volume are relabelled as core — and reads two seeds a side:
|
per-patient Dice, mean \(\cdot \) worst tenth |
WT |
TC |
ET |
ET false alarms |
|
ResNet-34 UNet, seed 0 |
0.893 \(\cdot \) 0.713 |
0.821 \(\cdot \) 0.470 |
0.804 \(\cdot \) 0.418 |
2.49% |
|
ResNet-34 UNet, seed 1 |
0.891 \(\cdot \) 0.699 |
0.818 \(\cdot \) 0.453 |
0.801 \(\cdot \) 0.421 |
2.42% |
|
3D UNet, seed 0 |
0.900 \(\cdot \) 0.747 |
0.827 \(\cdot \) 0.495 |
0.807 \(\cdot \) 0.464 |
1.07% |
|
3D UNet, seed 1 |
0.903 \(\cdot \) 0.772 |
0.830 \(\cdot \) 0.521 |
0.805 \(\cdot \) 0.440 |
1.03% |
Paired over patients the 3D means are ahead by \(0.009\) on WT and TC and \(0.004\) on ET, and the bootstrap interval excludes zero on WT alone. The tail is where the two part. On tumour core the 3D net’s worst tenth is above both 2D seeds’ on both of its own, and it raises a false enhancing-tumour alarm on under half as many slices, a gap twenty times the seed-to-seed spread on either side. On enhancing tumour its worst tenth is ahead on both seeds too, on one of them by less than the two 3D seeds differ from each other. Rank-5 convolution itself runs at 77% of the 2D per-voxel rate through XLA on this card, so the port is affordable; it is not built, and this section’s Lean trainer is the slice model.
Pairing a decoder to a backbone that has no unetDown.
The canonical UNet below pairs skips implicitly — \(i\)-th unetUp from the bottom with \(i\)-th unetDown from the top — which a ResNet encoder cannot satisfy. So unetUp also pairs by shape, with a preceding residual stage or a bare .maxPool’s input; that automatically passes over the bottleneck, which nothing upsamples into. Any ResNet here can therefore be a UNet contracting path. The backward join is .fpnDetect’s C3/C4/C5 tap reused, and routing one network both ways gives bit-identical parameters.
The encoder-decoder-with-skips shape is not specific to segmentation either: it later became the diffusion-model backbone (DDPM, Stable Diffusion, in the diffusion subsection below, §12.3), and the same two primitives carry that subsection’s generative pipeline. The layer kit is shared; only the loss and the inference procedure change.
UNet (Bestiary/UNet.lean)
Two new primitives (§ 163, § 164). Skip connections are implicit — the \(i\)-th unetUp from the bottom pairs with the \(i\)-th unetDown from the top. Variants: original (1-channel, 2-class), RGB, small, tiny. Original lands at 31M params matching Ronneberger (Ronneberger et al. 2015, arXiv:1505.04597).
def unet : NetSpec where
  name   := "UNet (original, grayscale → 2-class)"
  imageH := 512
  imageW := 512
  layers := [
    .unetDown 1   64,                           -- encoder stage 1
    .unetDown 64  128,                          -- encoder stage 2
    .unetDown 128 256,                          -- encoder stage 3
    .unetDown 256 512,                          -- encoder stage 4
    .convBn 512 1024 3 1 .same,                 -- bottleneck part 1
    .convBn 1024 1024 3 1 .same,                -- bottleneck part 2
    .unetUp 1024 512,                           -- decoder (skip: encoder 4)
    .unetUp 512 256,                            --         (skip: encoder 3)
    .unetUp 256 128,                            --         (skip: encoder 2)
    .unetUp 128 64,                             --         (skip: encoder 1)
    .conv2d 64 2 1 .same .identity              -- 1×1 conv to 2 classes
  ]
DeepLab v3+ (Bestiary/DeepLabV3Plus.lean)
One new primitive (§ 166). The pre-transformer segmentation workhorse (Chen et al. 2018, arXiv:1802.02611) — still deployed widely in remote sensing, medical imaging, and autonomous-driving perception pipelines. Two ideas: atrous (dilated) convolutions in the backbone’s last stage (param-count-free receptive-field expansion) + an ASPP module for dense multi-scale context at the deepest feature resolution. The “+” in v3+ adds a lightweight decoder that upsamples the ASPP output 4\(\times \) and concatenates a low-level skip from backbone stage 2. Variants: ResNet-101 backbone (59M, paper \(\sim \)63M), MobileNet v2 backbone (5.7M, paper \(\sim \)6M mobile variant), tinyDeepLab fixture. The ASPP skip-to-stage-2 in the decoder doesn’t linearize cleanly; same hack as UNet / WaveNet use. SegFormer (next entry) argues “do ASPP’s multi-scale context via a transformer pyramid”; different mechanism, same goal.
def deeplabv3plusResnet101 : NetSpec where
  name   := "DeepLab v3+ (ResNet-101 backbone)"
  imageH := 513
  imageW := 513
  layers := [
    .convBn 3 64 7 2 .same,                     -- stem
    .maxPool 3 2,
    -- ResNet-101 body; stage 4 uses stride 1 (atrous in real impl)
    .bottleneckBlock 64   256  3  1,
    .bottleneckBlock 256  512  4  2,
    .bottleneckBlock 512  1024 23 2,
    .bottleneckBlock 1024 2048 3  1,
    .asppModule 2048 256,                       -- ASPP: 5 branches + fusion
    -- Decoder (skip from stage 2 doesn't linearize; prose notes it)
    .convBn 256 256 3 1 .same,                  -- 3×3 refine conv→BN→ReLU
    .convBn 256 256 3 1 .same,                  -- 3×3 refine conv→BN→ReLU
    .conv2d 256 21 1 .same .identity            -- Pascal VOC: 21 classes
  ]
SegFormer (Bestiary/SegFormer.lean)
One new primitive (§ 157). Semantic segmentation (Xie et al. 2021, arXiv:2105.15203) via a hierarchical transformer pyramid (MiT encoder: 4 stages of .transformerEncoder glued by .patchMerging) and a lightweight MLP decoder (a handful of .dense calls). The decoder stays trivially small across all B0–B5 encoder sizes — the design argument of the paper is precisely that a good pretrained transformer feature pyramid makes the segmentation head cheap. Variants: MiT-B0 encoder (2.6M, paper 3.7M), B2 (19M, paper 25M), B5 (61M, paper 82M), shared MLP decoder (1M single-scale approx), tiny fixture. Uniform \(\sim \)25% undercount across all encoder sizes because real MiT uses depthwise convs inside the FFN, a strided convolution and norm for spatial-reduction attention, and overlapping patch embeddings at inter-stage transitions; our .transformerEncoder and .patchMerging approximate the shape without those details. Comparison to DeepLab v3+: SegFormer’s decoder is \(\sim \)3M params across all sizes, DeepLab’s ASPP module is \(\sim \)15M and needs per-receptive-field tuning.
def segformerB2 : NetSpec where
  name   := "SegFormer MiT-B2 encoder"
  imageH := 224
  imageW := 224
  layers := [
    -- Stage 1: 224 → 56, 64 channels, 3 blocks
    .patchEmbed 3 64 4 (56 * 56),
    .transformerEncoder 64 1 256 3,
    -- Stage 2: 56 → 28, 128 channels, 4 blocks
    .patchMerging 64 128,
    .transformerEncoder 128 2 512 4,
    -- Stage 3: 28 → 14, 320 channels, 6 blocks
    .patchMerging 128 320,
    .transformerEncoder 320 5 1280 6,
    -- Stage 4: 14 → 7, 512 channels, 3 blocks
    .patchMerging 320 512,
    .transformerEncoder 512 8 2048 3
  ]
SAM (Bestiary/SAM.lean)
One new primitive (§ 161). Promptable segmentation (Kirillov et al. 2023, arXiv:2304.02643): a ViT image encoder runs once per image, a tiny prompt encoder tokenizes clicks / boxes / masks, a lightweight transformer mask decoder cross-attends between image tokens, prompt tokens, and a handful of learned output queries. Image encoder is .patchEmbed + .transformerEncoder (the ViT kit); mask decoder is a small .transformerDecoder (from DETR, 4 queries, 2 blocks). Variants: SAM ViT-B encoder (88M, paper total 91M), ViT-L (307M, paper 308M), ViT-H (635M, paper 636M), shared 3.3M mask decoder, tinySAM fixture. The image encoder accounts for \(\sim \)99% of each variant’s parameter budget, which is why EfficientSAM (Xiong et al. 2023) focused its distillation there.
def samEncoderH : NetSpec where
  name   := "SAM ViT-H image encoder"
  imageH := 1024
  imageW := 1024
  layers := [
    -- 16×16 patches on 1024×1024 → 64×64 = 4096 tokens
    .patchEmbed 3 1280 16 SAM_PATCHES,
    .transformerEncoder 1280 16 5120 32          -- 32 blocks, dim 1280
  ]